Datadis integration, shared access and improvements in data visualisation
We hope you are wrapping up the winter season nicely and that the arrival of spring is a very positive one for everyone. As we do every month, here are the latest developments in our solutions.
Datadis integration
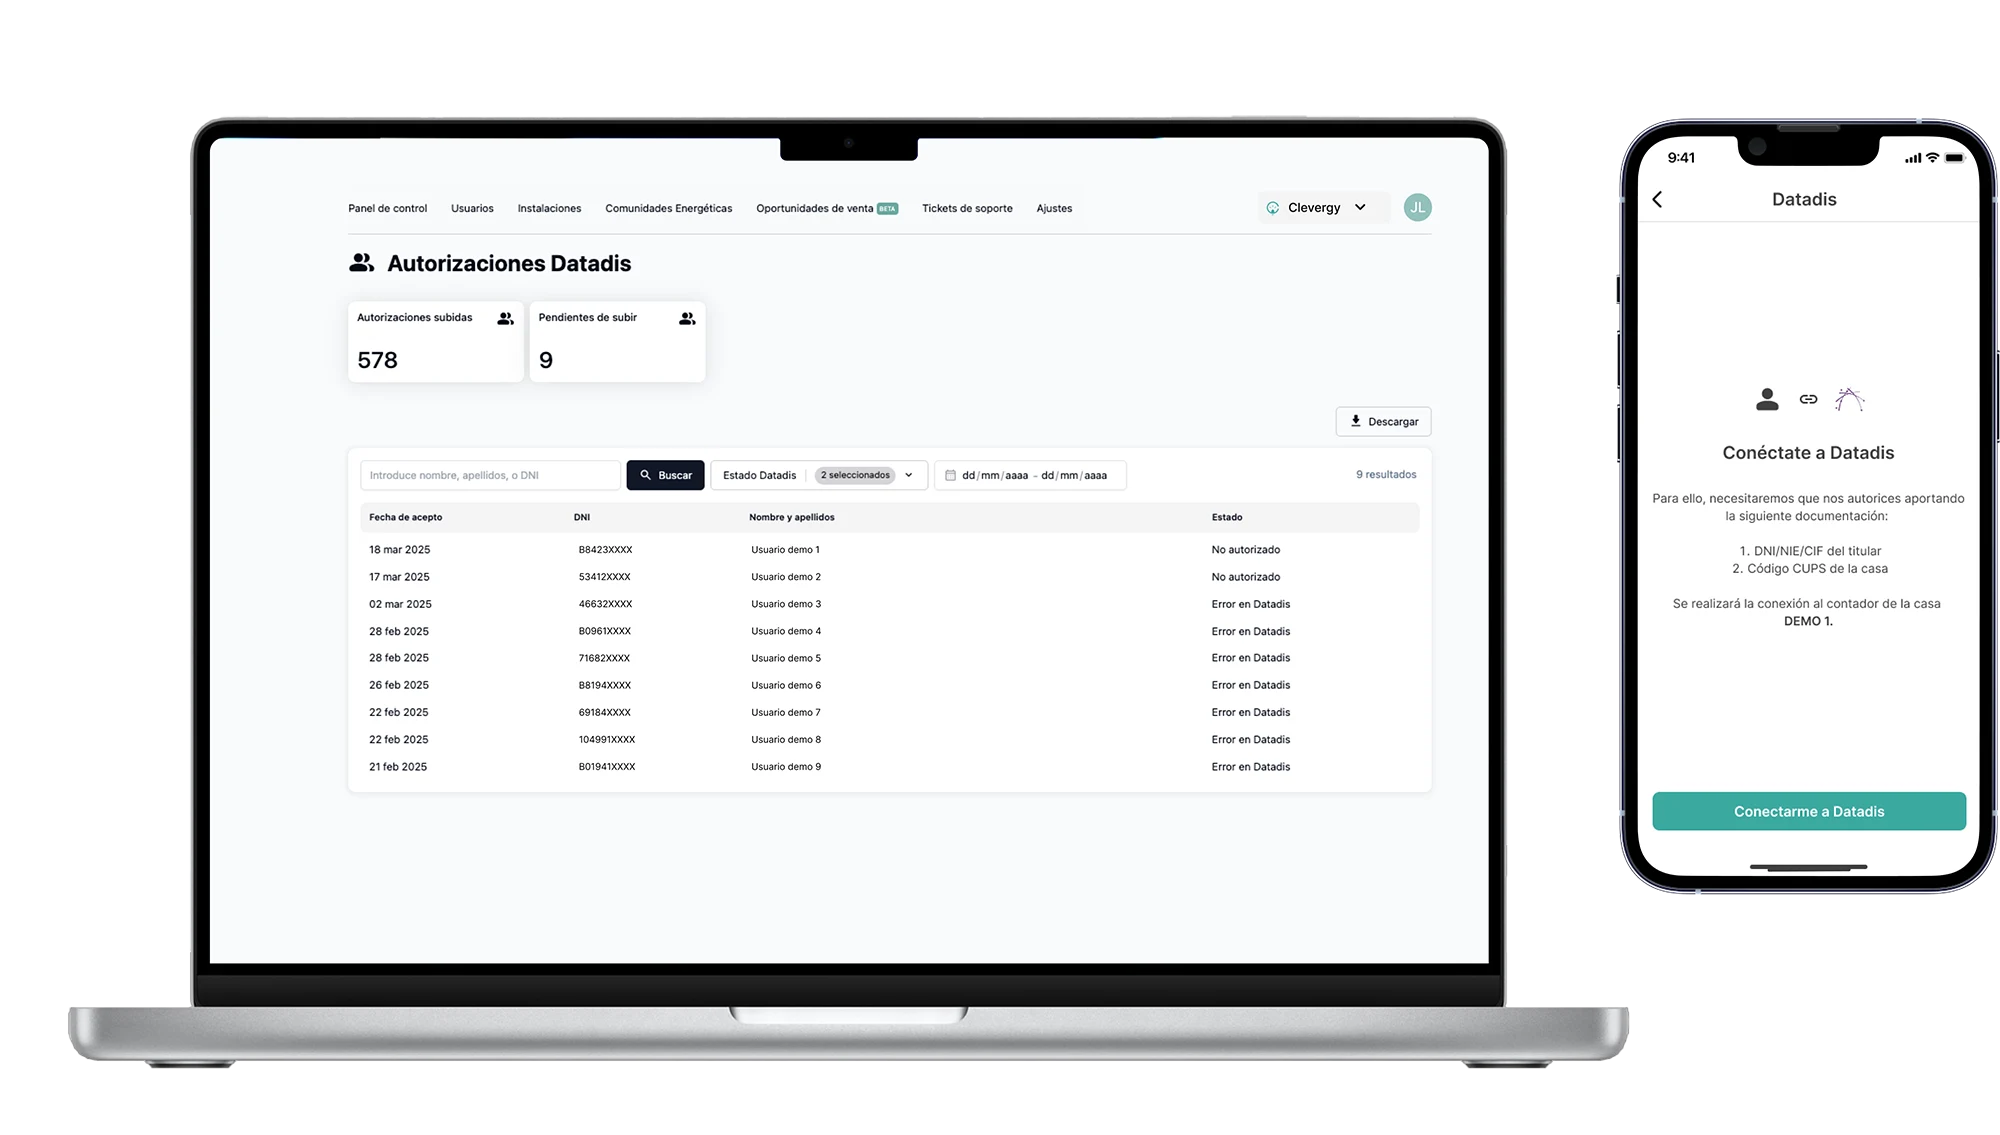
Registering with Datadis lets your users see their daily consumption in the app. For this to be possible, your company first needs to sign a partner agreement with Datadis.
The integration makes this process easier and has two parts:
- validating the user's identity in Datadis, accessible from the app
- authorisation by your company in our platform, to guarantee security and data protection.
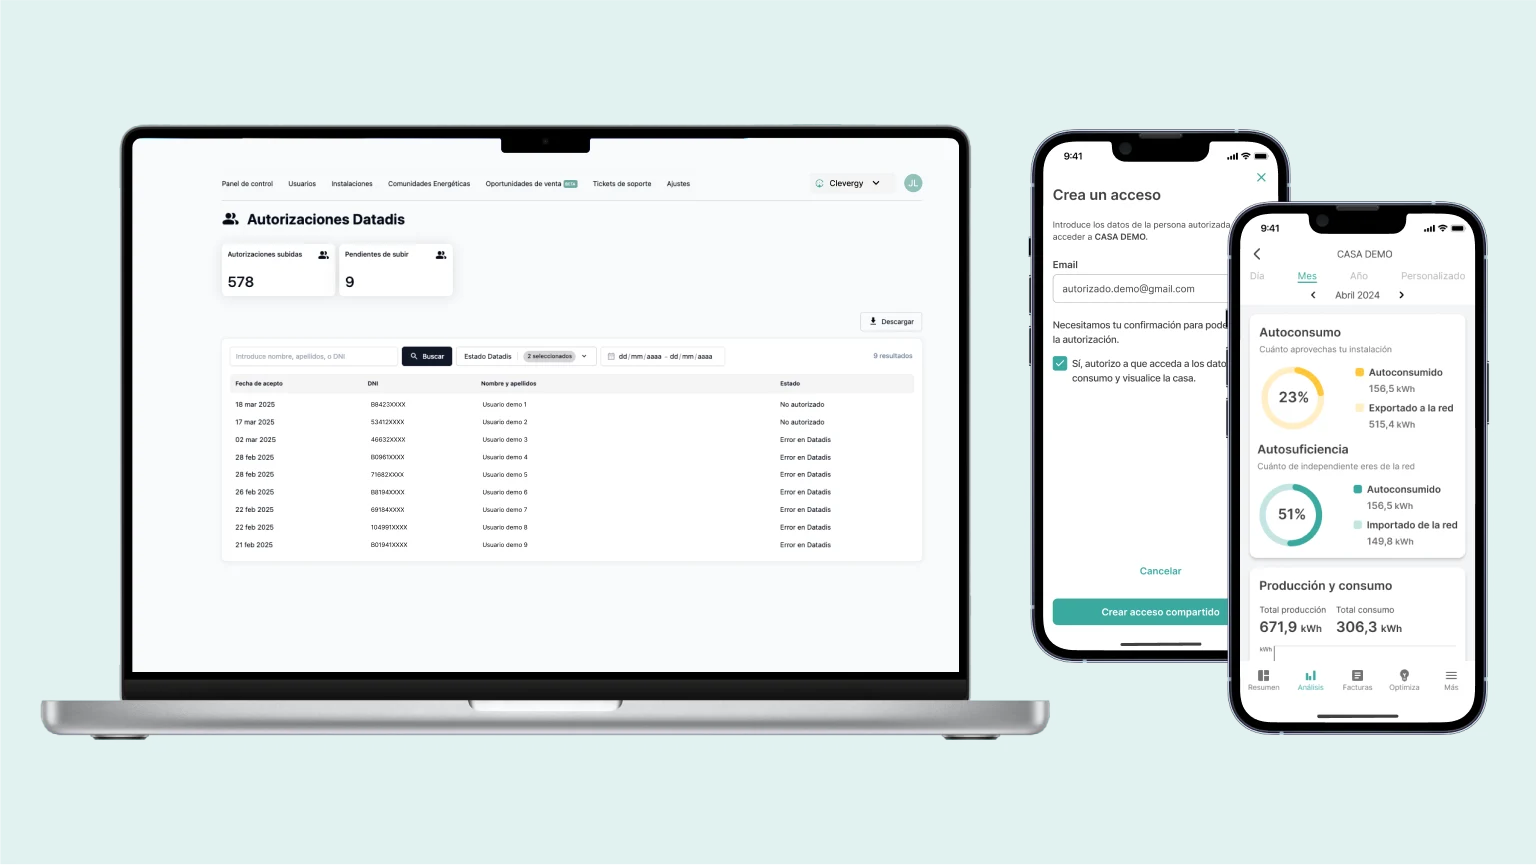
As for authorisation, we have streamlined the process for our clients with a new portal function under “Datadis authorisations” that:
- Tells you how many users need to be authorised
- Provides you with a template containing pre-collected data for validation
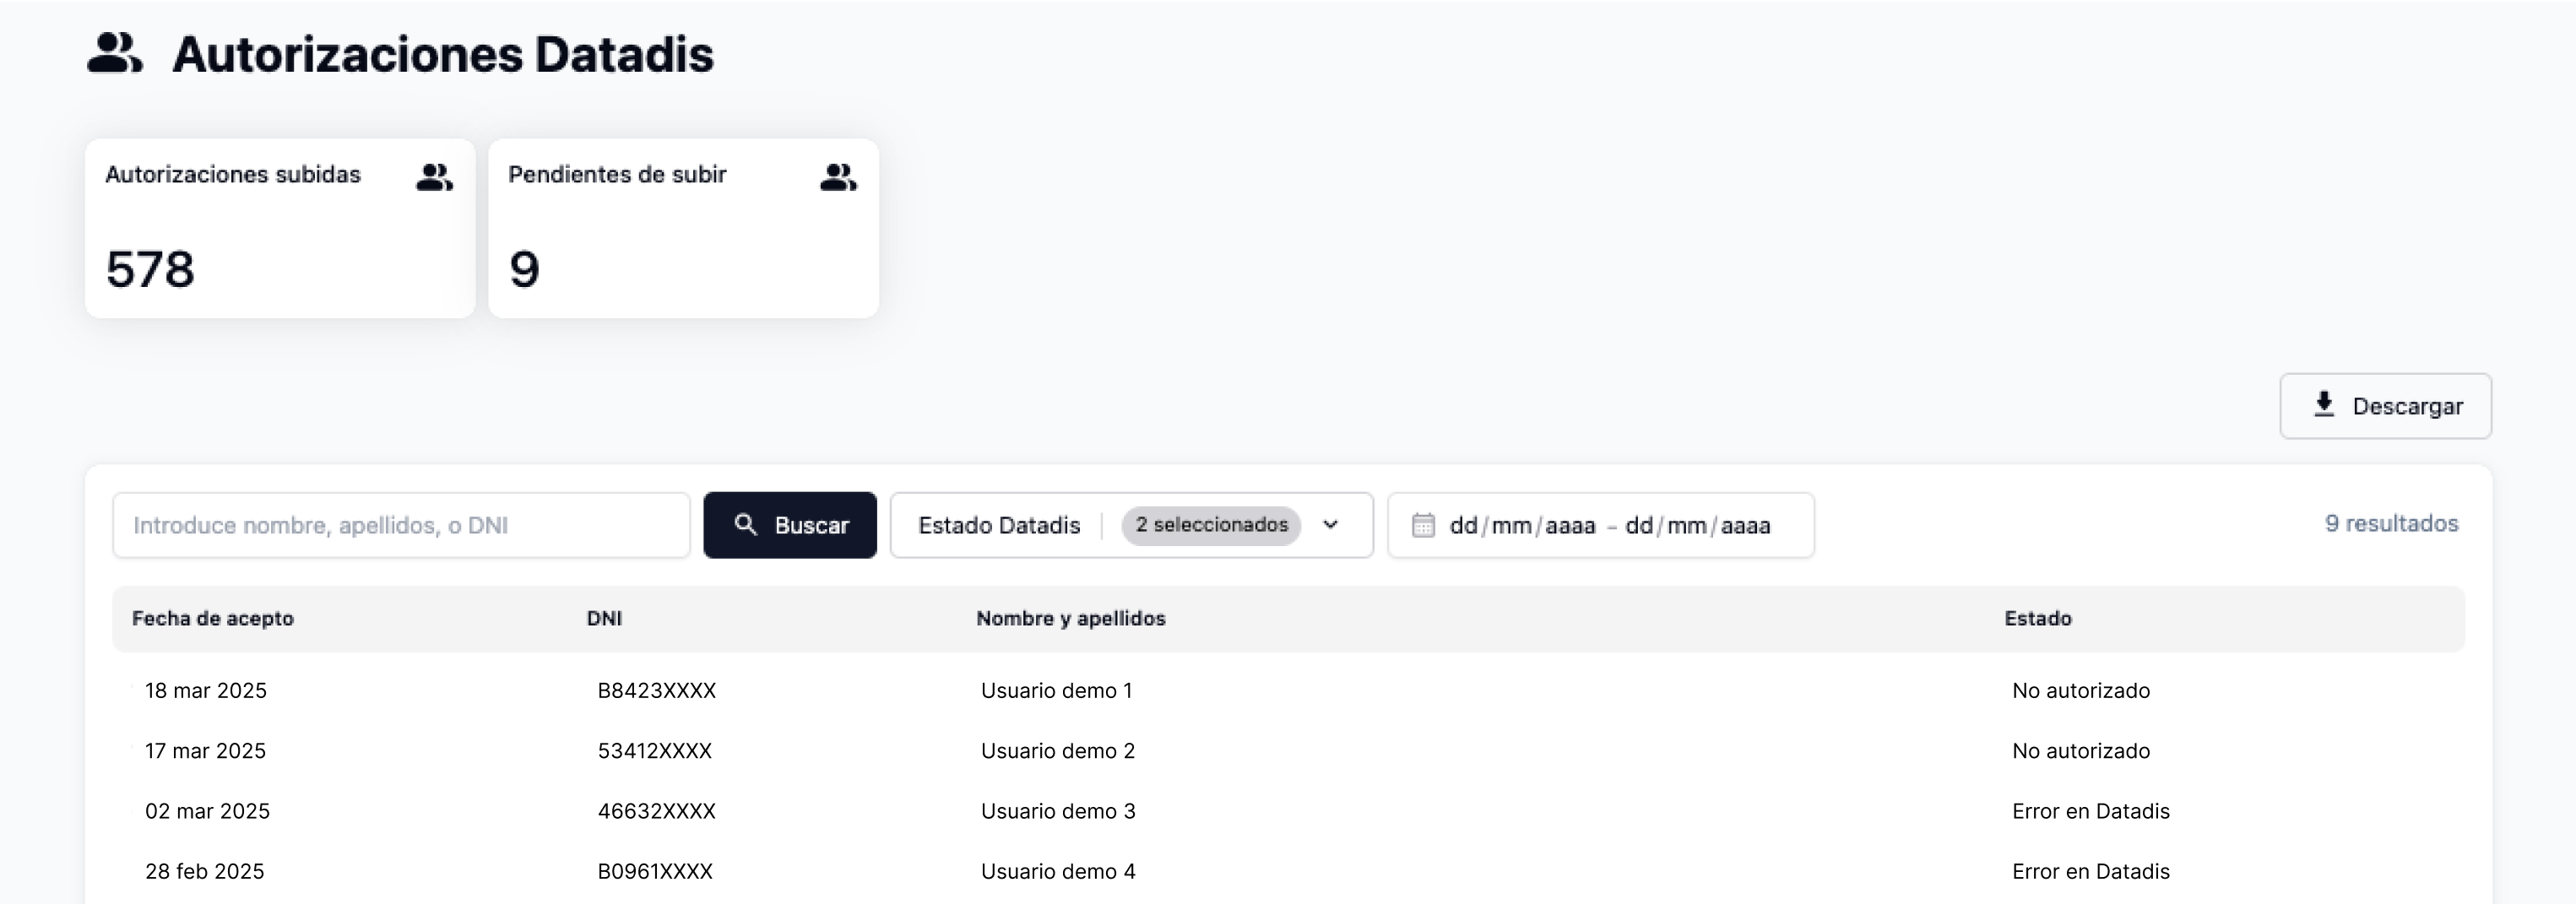
You can find more information on the details of this integration in our documentation: Datadis integration.
Shared access
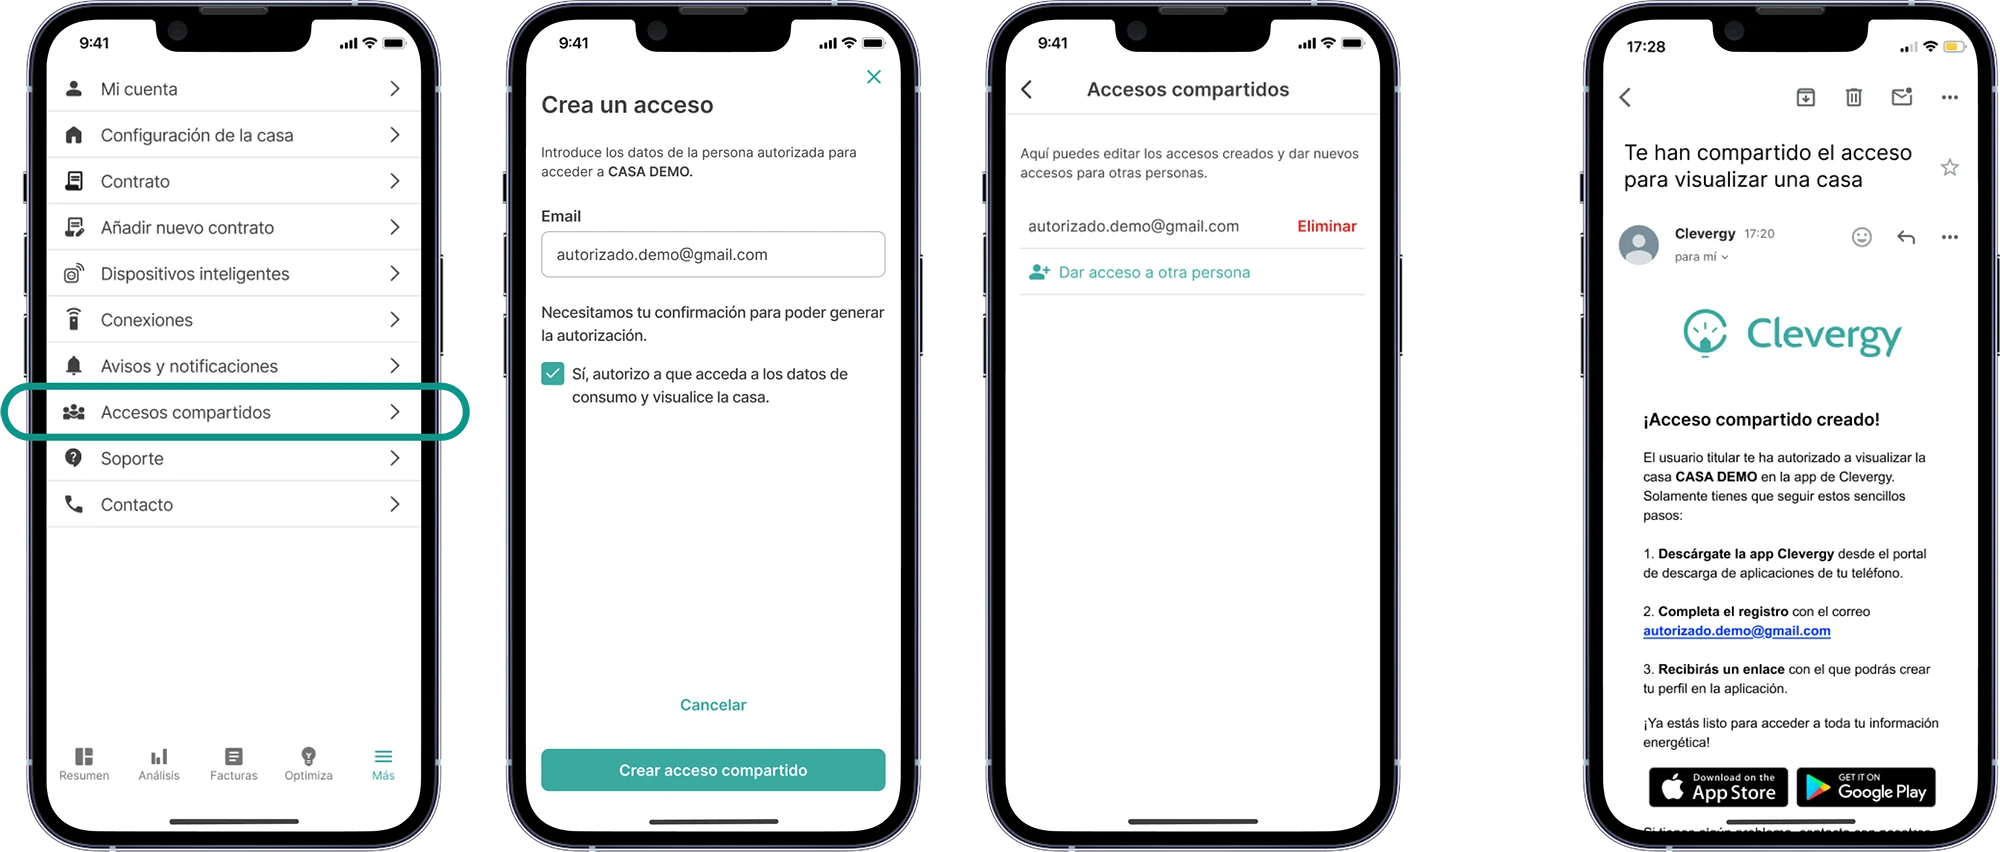
It is common for a user to want to share their consumption data with their partner, flatmate, tenant, employee… The new shared access function lets any user authorise another person to access the information for one of their homes within the apps.
The new feature makes this option easy for your clients, simply and with complete transparency:
- The account holder selects the home whose data they want to share
- Only the main user can grant access to the data
- Access can be revoked at any time
- The new user receives an invitation to download the app and gain access
You can find more information on the details of this integration in our documentation: Shared access authorisations
Improvements in data visualisation
We have made improvements both to the portal dashboard and to some screens in the client apps.
The portal control panel has been improved by adding several new KPIs:
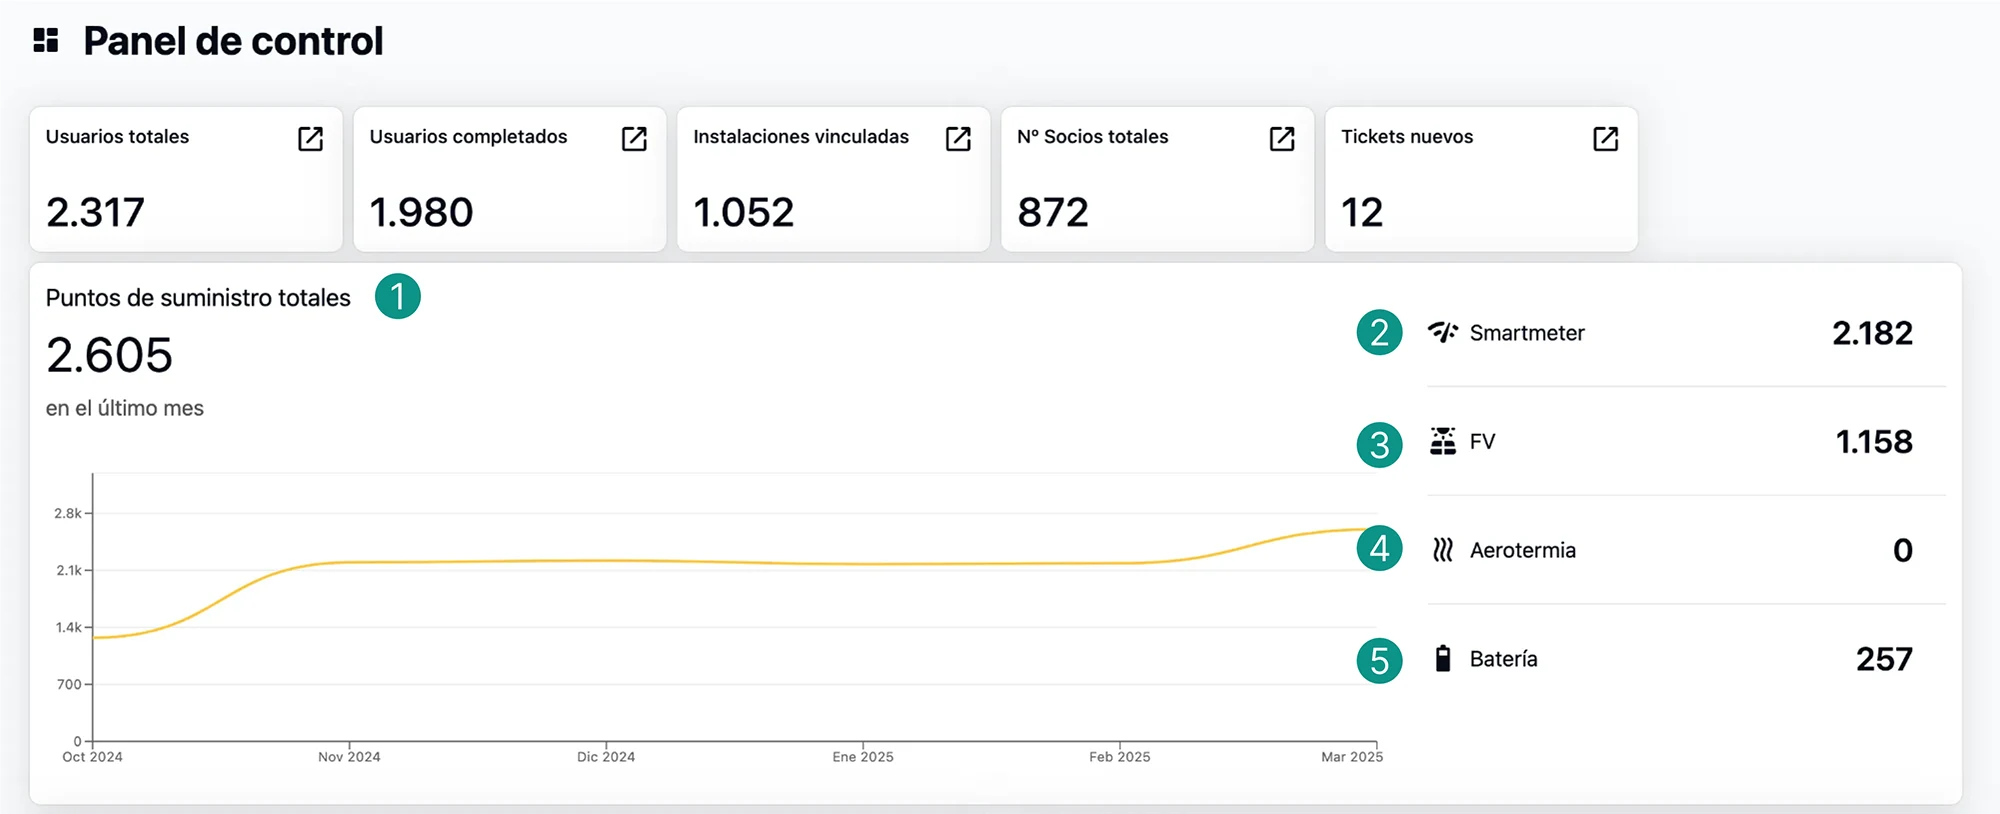
- Supply points: homes.
- Smart Meters: homes that have a connection to Datadis, FTP or their own integration.
- PV: solar installations.
- Aerothermal: homes that have an aerothermal system.
- Batteries: installations that have a battery.
As for the improvements in the client app, we have updated the installation summary. It is now easier to understand and the percentages look much better.
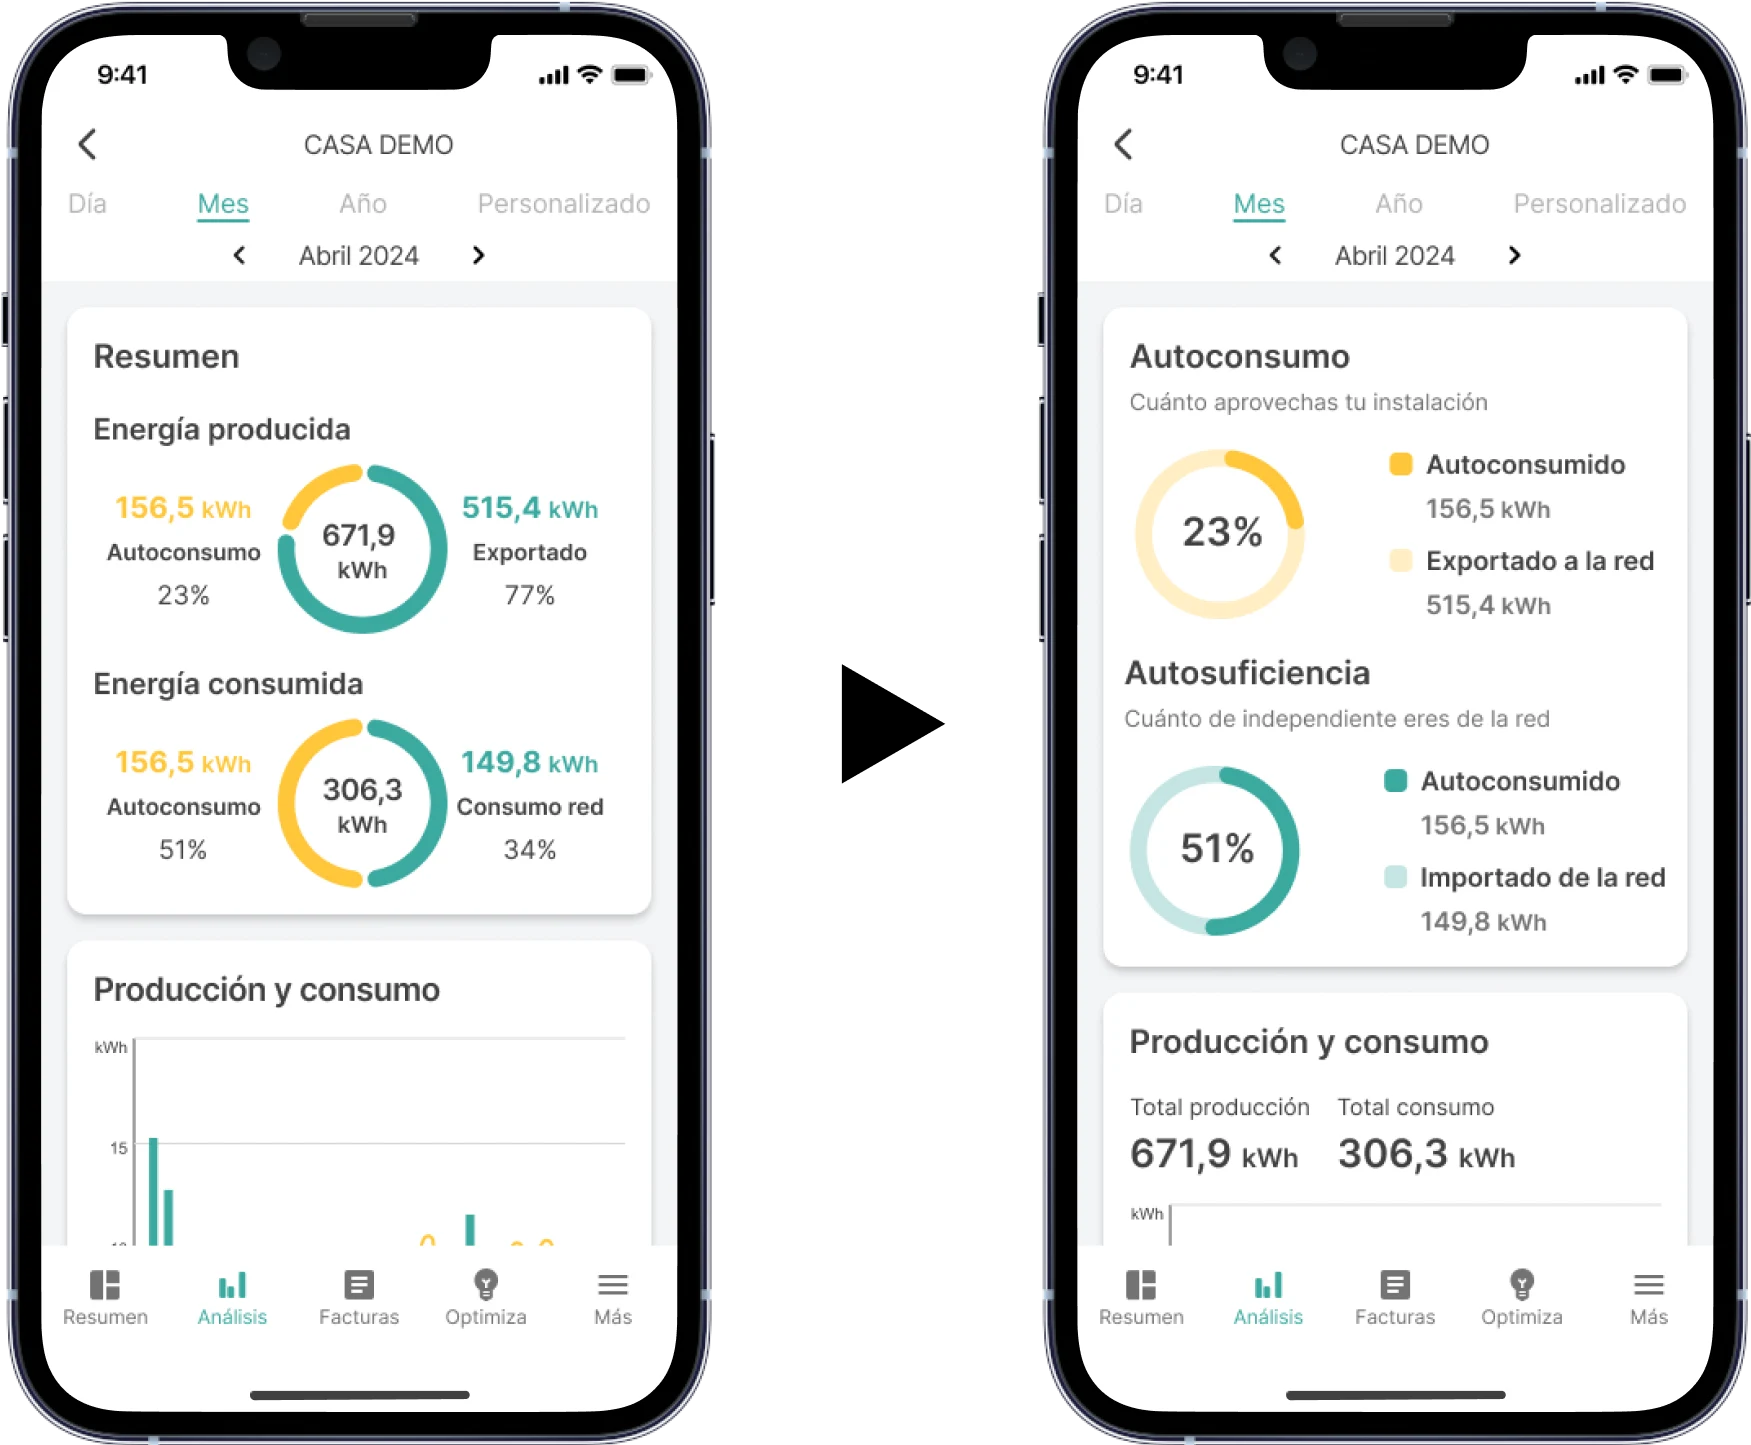
- The current chart design does not help simplify this data reading; it is hard to know which figure you need to read, compare…
- It is difficult to draw conclusions or actionable points after reading it.
- The information is simplified by reinforcing the “self-consumption” values for the production breakdown and “self-sufficiency” for the consumption breakdown.
- The production and consumption totals are included alongside the lower “Production and consumption” module, distributing the amount of data between the two modules.