In Clevergy we offer users several functionalities to save energy. We show users how they consume at home and how to have a better relationship with energy. We help them giving energy insights such as the consumption by disaggregation of appliances, the hourly consumption by time ranges, the estimated consumption in bill cost, the possibilities of saving through the modification of contracted power or a change of electricity supplier and many more energy recommendations.
The problem
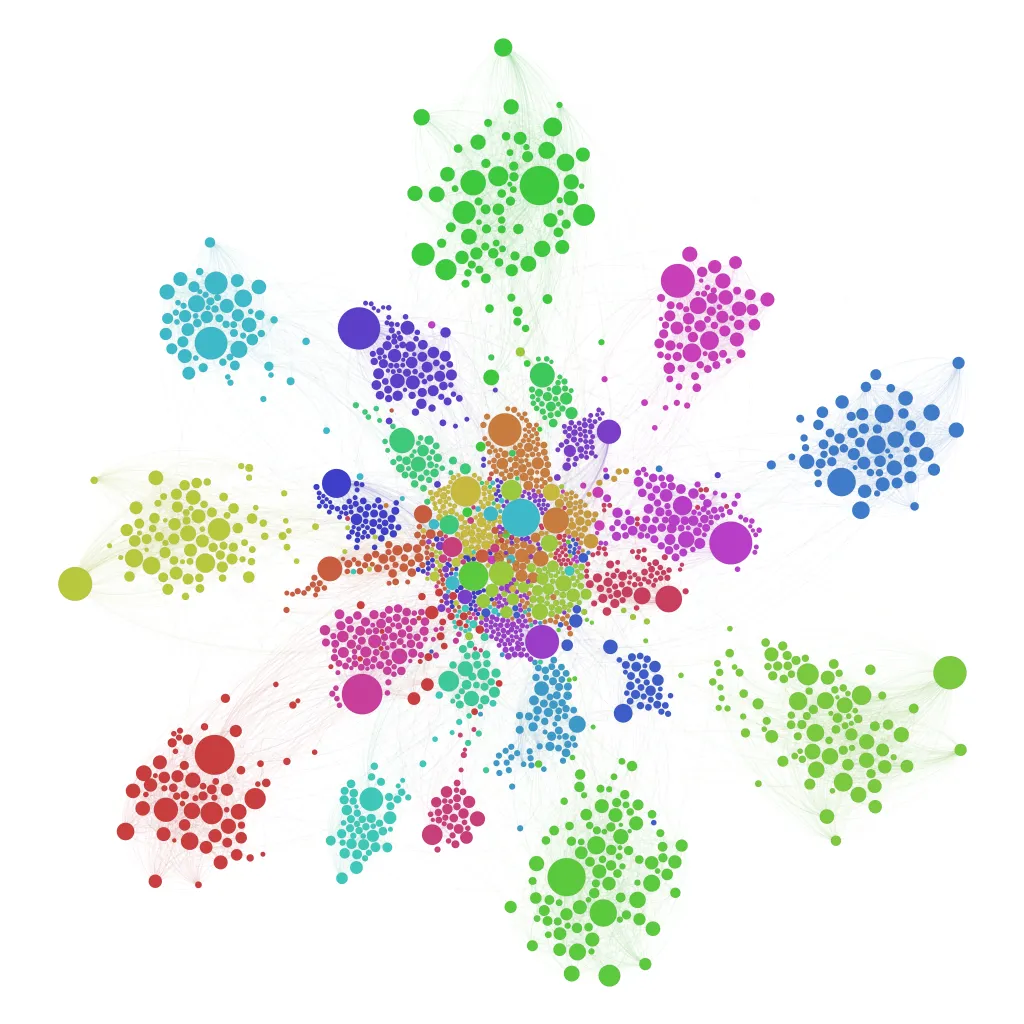
At this time, we are going to refine a functionality that allows an understanding of how much they are spending compared with “similar”households to yours. 120 kWh is not too much or little, it is what it is, and it is essential to understand if you can improve it. To solve this problem we have faced the challenge of classifying the homes of our customers in similar groups in terms of the energy profile of the houses. Once the groups where made we placed them in a percentile of expenditure compared to other houses allowing the user to understand how well they are spending.
The first thing we have to define is: What does it mean “similar homes”?
In this case, we approach the question from a multifactorial point of view.
Similar dwellings cannot be dwellings that have similar consumption. A small house that consumes n kWh in a cold place basically due to a basal consumption of heating, has nothing to do with a large house that consumes the same energy at peak hours due to the consumption of kitchen appliances.
On the other hand, we cannot classify by spatial “neighbors” either, since very close houses may have nothing to do with each other from the point of view of energy consumption.
Data pre-processing

We have studied comparable factors when classifying houses and have found several key elements to be able to group them.
- Square meters. From an energy point of view, it is practical to classify dwellings primarily by size.
- Electricity consumption potential. We have seen that no matter how similar the houses are in terms of characteristics, it does not make sense for example to group as similar a house with gas heating and one with electric heating (statistical studies indicate that electric heating is almost 50% of household consumption), so we propose to estimate a volume of Kw “available” by multiplying the devices that we know that a house has by its average nominal power.
- Climate profile. Spain is a country in which we can find very different climatic profiles even within the same regional organizations. We have used for our grouping the Mediterranean, cold inland, warm inland, Atlantic, and Cantabrian profiles. We have assigned each complete province to one of these climates.
- Housing type. We know that this is an assumption that can have nuances, but we prefer to use it to characterize the level of energy performance we take as distinct single-family homes and apartments.
For this first version we are using only those few features, but we are currently working on really amazing features to enrich our houses dataset, such as real-time climate profile, state information about housing properties, energetic profile (isolation level), and satellite images to identify roof areas in houses with solar production.
Once we have these columns calculated for each house we proceed to calculate the grouping of dwellings according to these characteristics.
A first approach to the solution
In the first approach, we proposed the possibility of using Python mathematical libraries to build a service that would perform the classification in three steps:
- A PCA (Principal component analysis). This filter would modify the dataset dimensions to make it two-dimensional, from two columns to a single pair of values, in order to be able to run K-means against a two-dimensional vector.
- A study of a possible number of centroids. To achieve an optimal result, we ran a clustering simulation for several values of the total centroids, calculating the error of each run and saving the one with the smallest deviation.
- Cluster assignment to each house using K-means.
Once the cluster IDs are assigned, the houses are persisted again in order to retrieve each set and its consumptions from the services that make up the application. As this process can be heavy it is periodically executed in the background.
Once we have the classification we use GCP’s VertexAI to train a classification model that allows us to have an API to query in case we receive houses that are not yet grouped, and it returns the cluster most similar to the new house.
Easier is better
Once we finished the proof of concept of the classifier we realized that the classification process based on the VertexAI service, despite being very comfortable for us, introduces the error inherent to the model added to the error introduced by the K-means algorithm, so we decided to eliminate it from the equation by directly calculating the cluster of a new house through the minimum distance to the centroids.

On the other hand, and taking into account that our proof of concept does not have a sufficient entity, nor does it fully correspond to any domain, we decided to eliminate the service and include it in one of our services.
As our services are programmed in Kotlin, we decided to use WEKA, which also allows us to eliminate the principal component analysis part and do clustering on multiple dimensions.
This way we eliminate almost all the complexity and have amazing results. And we did it with 4 lines of code!

Conclusions
In an unsupervised analytical process, as in the case of the application of the K-means algorithm, it is essential to make iterations that allow us to analyze the quality of the solution. In this context, we have put effort into preparing a dataset at the input of the algorithm containing processed data in each column to give us an ideal result.
We always use control metrics to know if we gain precision in our systems, and in this specific use case, we work with a baseline that allows us to know if we should optimize the number of clusters based on the accumulated errors in each iteration.
In engineering, it is an excellent decision to refactor a process no matter how expensive it has been if the result is going to be lighter and simpler. It is essential not to be afraid to destroy and redo if there are guarantees that the refactoring will allow easier maintenance and better fault tolerance.


